Product: 3-Day Forecast
- Issued: 2026 Jul 17 0030 UTC
Prepared by the U.S. Dept. of Commerce, NOAA, Space Weather Prediction Center.
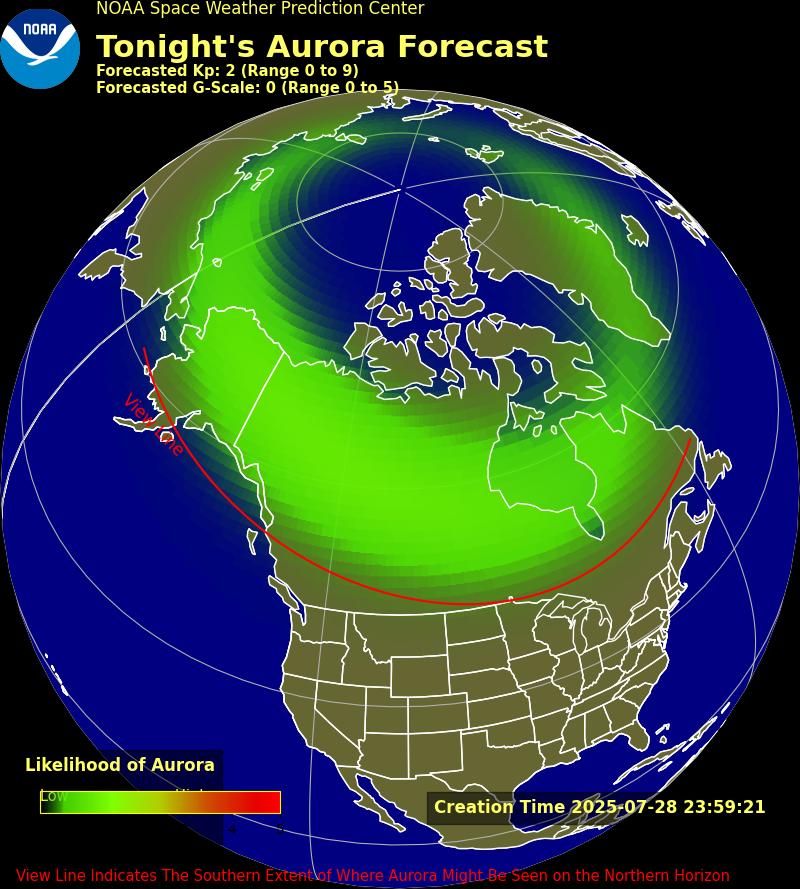
Geomagnetic Activity Observation and Forecast
The greatest observed 3 hr Kp over the past 24 hours was 3 (below NOAA Scale levels). The greatest expected 3 hr Kp for Jul 17-Jul 19 2026 is 3.00 (below NOAA Scale levels).
| Jul 17 | Jul 18 | Jul 19 | |
|---|---|---|---|
| 00-03UT | 2.00 | 2.33 | 1.67 |
| 03-06UT | 1.67 | 3.00 | 2.00 |
| 06-09UT | 1.67 | 1.67 | 1.67 |
| 09-12UT | 1.67 | 1.67 | 1.33 |
| 12-15UT | 1.67 | 1.00 | 0.67 |
| 15-18UT | 1.67 | 1.00 | 0.67 |
| 18-21UT | 2.00 | 2.00 | 1.67 |
| 21-00UT | 2.00 | 2.33 | 1.67 |
Rationale: No G1 (Minor) or greater geomagnetic storms are expected. No significant transient or recurrent solar wind features are forecast.
Solar Radiation Activity Observation and Forecast
Solar radiation, as observed by NOAA GOES-18 over the past 24 hours, was below S-scale storm level thresholds.
| Jul 17 | Jul 18 | Jul 19 | |
|---|---|---|---|
| S1 or greater | 1% | 1% | 1% |
Rationale: No S1 (Minor) or greater solar radiation storms are expected. No significant active region activity favorable for radiation storm production is forecast.
Radio Blackout Activity and Forecast
No radio blackouts were observed over the past 24 hours.
| Jul 17 | Jul 18 | Jul 19 | |
|---|---|---|---|
| R1-R2 | 25% | 25% | 25% |
| R3 or greater | 1% | 1% | 1% |
Rationale: There is a chance for R1-R2 (Minor-Moderate) radio blackouts over 17-19 Jul.
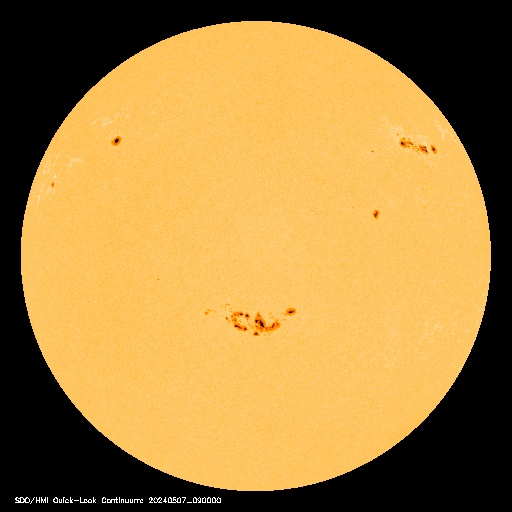
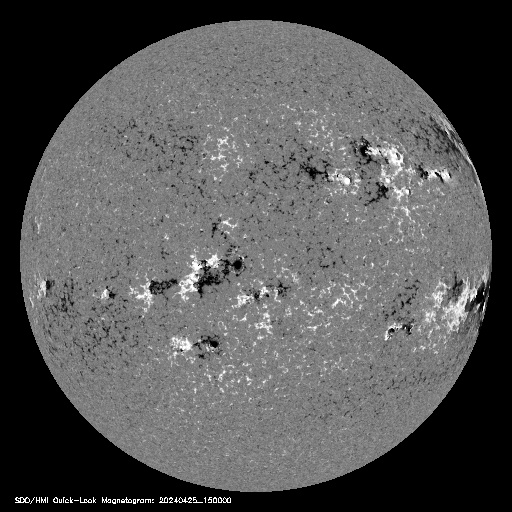
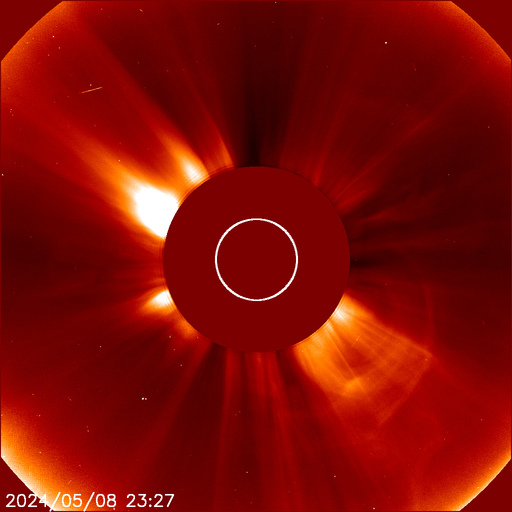
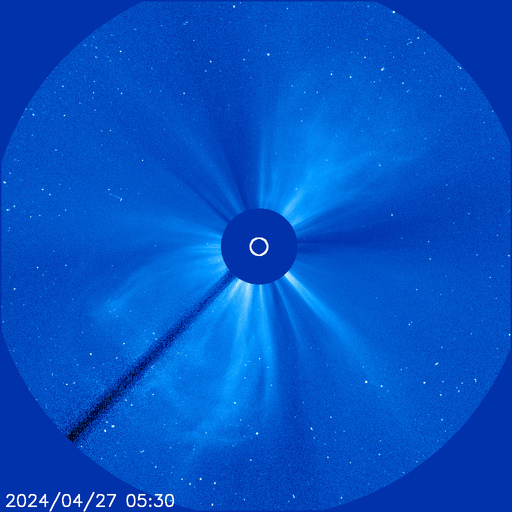
Space Weather Overview


Credits
Space Weather Images and Information (excluded from copyright) courtesy of:
NOAA / NWS Space Weather Prediction Center
Mauna Loa Solar Observatory (HAO/NCAR)
SOHO (ESA & NASA)
Powered by Space Weather PHP script by Mike Challis of Long Beach Weather.
Additions by Ken True of Saratoga Weather and Jerry Wilkins of Southeast Lincoln Weather.